
// DASHBOARD EXAMPLES
Power BI dashboard examples for every team and industry.
Finance, sales, operations and HR dashboards designed by our consultants in Jakarta, shown with sample data. Book a demo to explore one live.
// BY FUNCTION
A dashboard for each team.
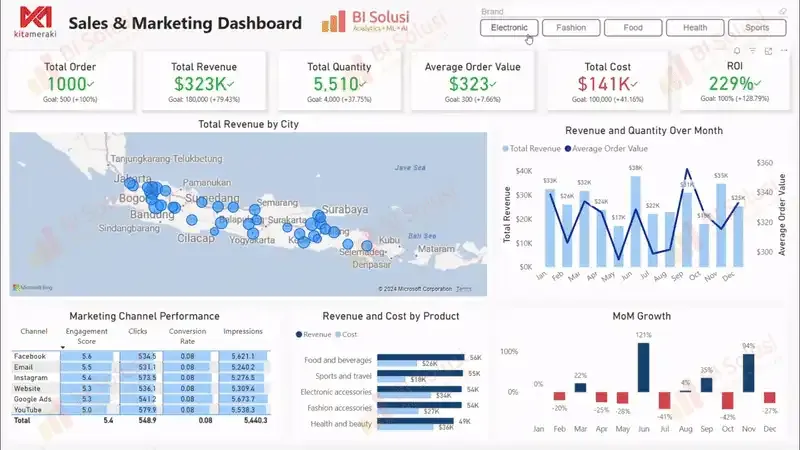
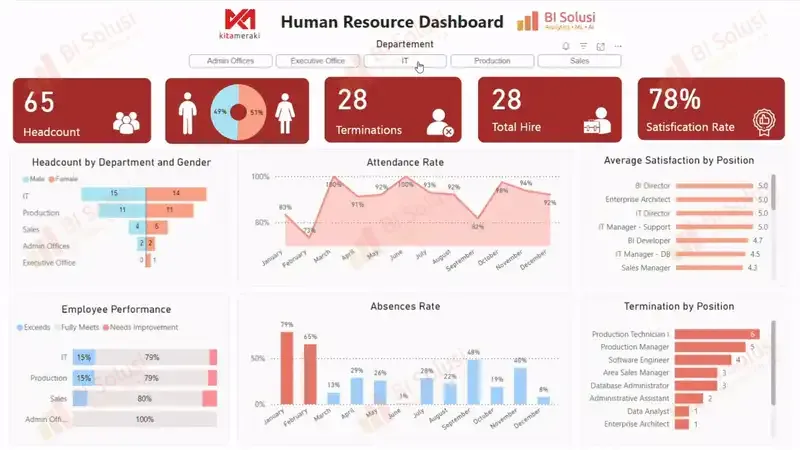
Each example uses sample data. Your dashboard is designed around your own accounts, products and KPIs.
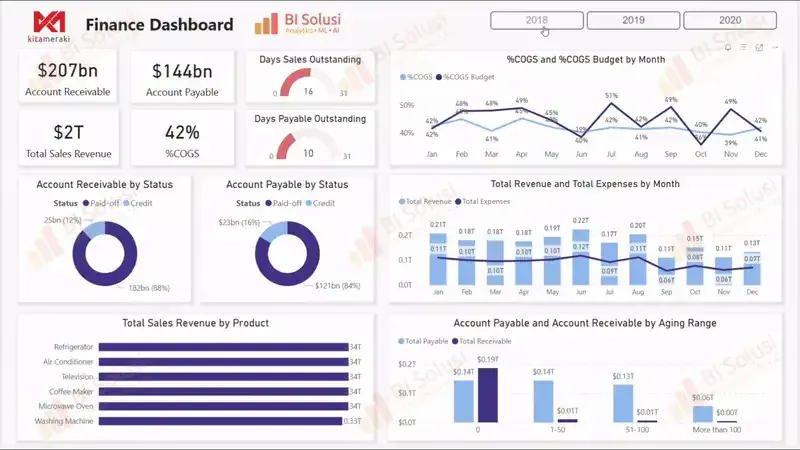
Finance & Accounting
- ✓Revenue and expenses by month
- ✓DSO, DPO and ageing
- ✓COGS % against budget
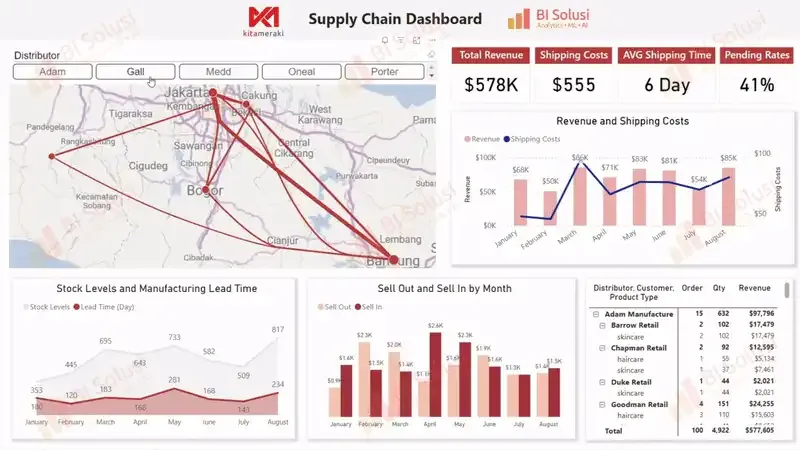
Operations and supply chain
- ✓Revenue against shipping costs
- ✓Stock levels and lead times
- ✓Sell-in against sell-out
// BY INDUSTRY
Dashboards built for your sector.
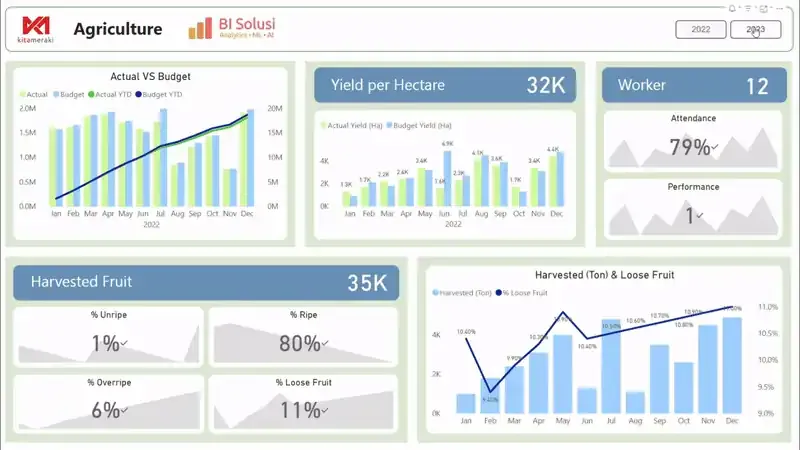
Agriculture and palm oil
- ✓Yield per hectare against budget
- ✓Harvester efficiency
- ✓Loose fruit and ripeness
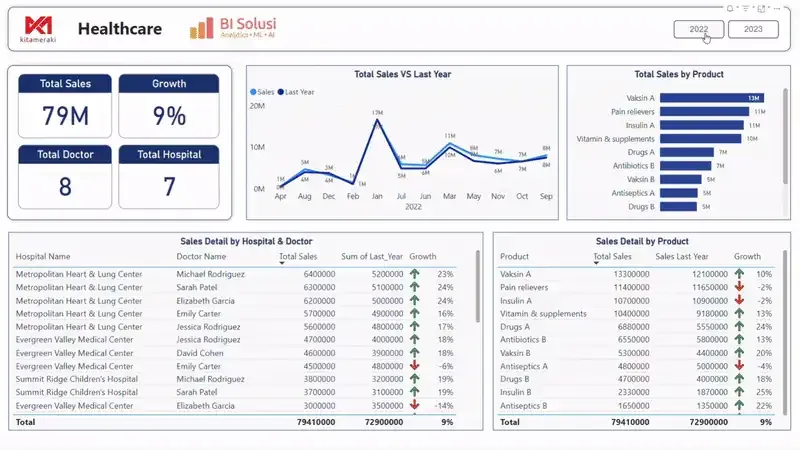
Healthcare and pharma
- ✓Sales against last year
- ✓Sales by hospital and doctor
- ✓Sales by product
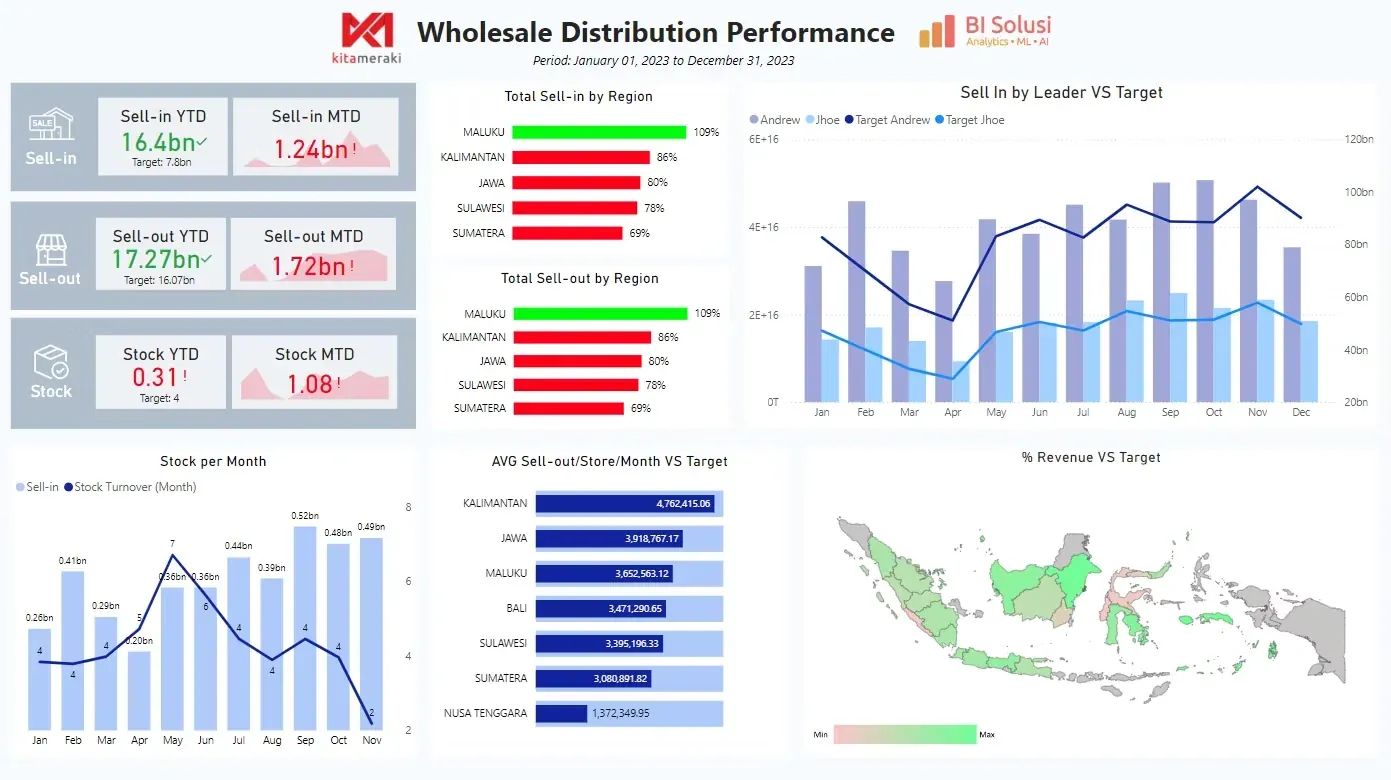
Wholesale and distribution
- ✓Sell-in and sell-out, YTD and MTD
- ✓Stock by distributor
- ✓Sales leaders against target
// FAQ
Questions about the examples
Can we explore a dashboard ourselves?
Yes. Book a demo and a consultant walks you through a live dashboard, then gives you access to try it.
Can you build one on our own data?
Yes. We start with a preview on part of your data, so you see your own figures before committing to a project.
Are these Power BI or Tableau?
Most examples are built in Power BI. We build the same kind of dashboards in Tableau.
Want to see one with your own data?
Book a demo.
A free first session with a senior consultant, in English or Bahasa Indonesia.